This post was originally published at https://www.linkedin.com/pulse/primer-probabilistic-planning-forecasting-stefan-de-kok/
I have been blogging and advocating for the past 15 years on probabilistic approaches to planning and forecasting, and am happy to see in the last few years it has finally started gaining traction and attention. But many questions and misperceptions still abound, about what it is and what is required. I could fill a large textbook to explain it all in detail (and I am in the process of doing just that), but here I will touch on a few key aspects.
What Makes It Probabilistic?
The critical criterion that makes a plan or forecast “probabilistic” is that the internal mathematics work on probability distributions instead of exact numbers for any value representing something uncertain. Generally, this means anything in the future. This could include quantities, lead times, production rates, yields, and so forth. The opposite of probabilistic is “deterministic”, which uses exact numbers to approximate uncertain amounts, often some historical average.
A symptom of a probabilistic plan or forecast is that its results are generally also expressed as probability distributions. Where a deterministic plan or forecast is generally expressed as a set of time series of exact numbers, a probabilistic plan or forecast is expressed as a set of time series of probability distributions. It is important to realize even results of deterministic plans can be expressed as distributions, but that does not imply that they are probabilistic. For example, fitted error of statistical forecasts can be expressed as a distribution, assuming it has a normal distribution centered around the forecasted number. The output can then be presented as a “range forecast”. But this should not be confused with a probabilistic forecast. A range forecast that is statistically determined will generally have a large error due to the naive assumption of the distribution being independent, identically distributed (i.i.d.) and Gaussian (aka having a normal distribution), which is rarely true in the real world.
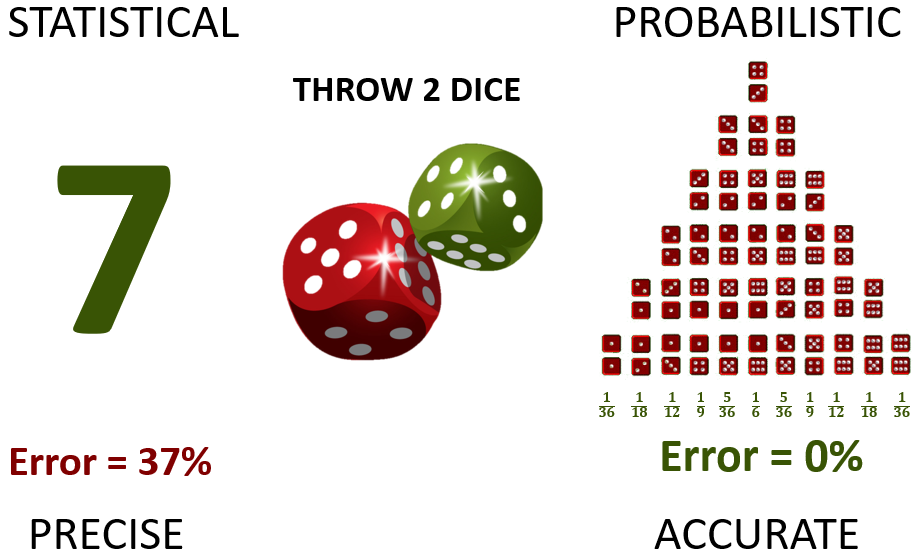
As an example, consider repeatedly throwing two dice. An unbiased statistical forecast will state that you will throw seven every time, since that is the expected average. A probabilistic forecast will be expressed as various probabilities of throwing any potential outcome:

Figure 1: a statistical forecast of throwing 2 dice (left) and its probabilistic equivalent (right)
The “error” on the statistical side is not really an error of the forecast at all. It is the inability to distinguish between true error and natural variability.
If we show this as time series, both would be level (stationary) since the outcome is identically distributed each throw. More typical for supply chain data they would look similar to this:

Figure 2: a statistical forecast (left) and a probabilistic one (right) for weekly data. Time is horizontal, forecast quantity vertical.
Lighter shades of blue indicate lower probability of occurring (a visual simplification for easier interpretation). The red dashed lines are typical confidence ranges or range forecast.
The Value of Probabilistic Methods
The root of the value of the probabilistic approach is that it can properly distinguish between error and natural variability, and between signal and noise, which is impossible in the deterministic perspective. This has three main consequences:
- Risk and opportunity are impossible to determine accurately from deterministic plans and forecasts.
- It is impossible to properly judge deterministically how good or bad a plan or forecast is.
- It is impossible to determine with any degree of accuracy where to focus improvement efforts based on deterministic plans or forecasts.
A symptom of these limitations are the various metrics used. If you have a MAPE of 60% , is that good or bad? And if you believe it is bad, how much better could you make it? Honestly, that is impossible to say.
Probabilistic forecasting approaches provide rich information to identify risks and opportunities at all levels of detail, allowing informed business decisions to be made. They also allow perfect delineation of the things you can control and improve versus the things you cannot. It is possible to create metrics (probabilistic metrics!) that perfectly quantify signal versus noise, error versus variability, precision versus accuracy.
Precision vs. Accuracy
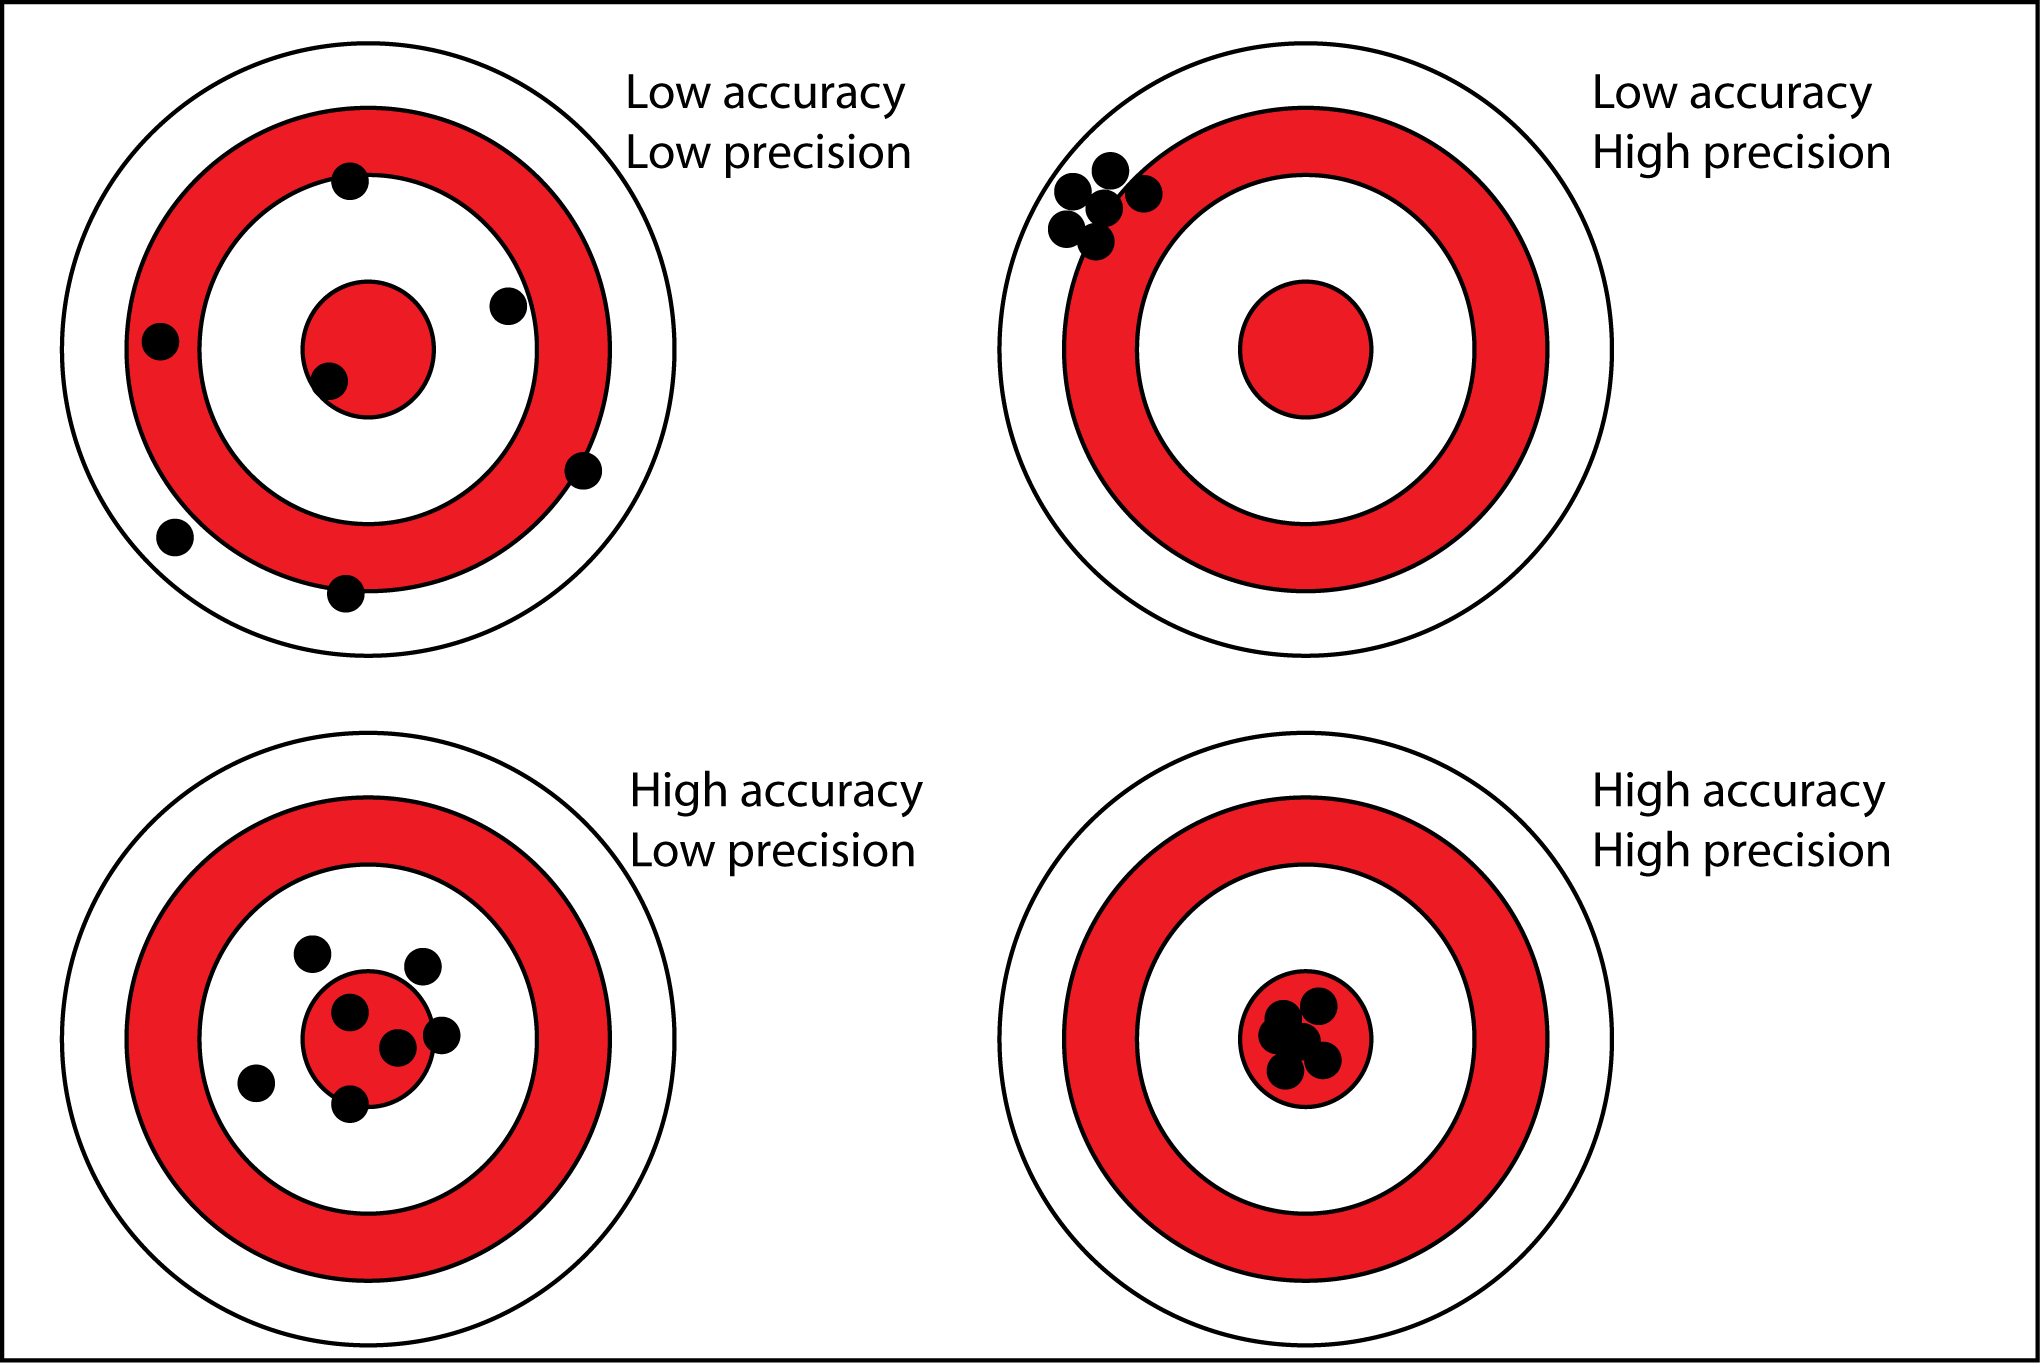
This brings us to the topic of precision and accuracy. These terms have been used in the forecasting domain for over half a century, and often interchangeably. Frankly, they have been used wrong. They have different meanings in the forecasting domain than every other domain. And this is due to the deterministic perspective not being able to distinguish between the two. So, arbitrary convolutions of the two were historically assigned names that in other domains have pure and clear meanings. The probabilistic perspective allows reclaiming these terms and using them in the generally correct way:

Figure 3: precision versus accuracy
In the pure perspective, precision and accuracy are orthogonal: they say something completely different about the same thing.
- Accuracy – how close to target is the plan/forecast on average
- Precision – how close are the plan/forecast values to each other
Accuracy can be expressed on a known scale (such as 0% to 100%) where each value is really possible, but it cannot be determined at time of forecasting. Precision can be determined at time of forecasting or planning because it is independent of the actual values, but it is on an unknown scale. Deterministic metrics can never be determined before actual values are known, and most are on an unknown scale. So-called in-sample approximations tend to severely underestimate true values. The worst of both downsides.
When we apply these concepts to the example in figure 1, it should be clear that statistical forecasts are precise but inaccurate. They are expressed as exact numbers, which are generally wrong. On the other hand, probabilistic forecasts can be perfectly accurate, but are imprecise. They are expressed as vague ranges, but these can be true representations of reality. They are polar opposite approaches! You cannot tweak one to get the other. They are fundamentally different.
Myths about Probabilistic Methods
There are a few misconceptions that are regularly raised when talking about probabilistic methods that are beyond the scope of this primer. I will likely write additional articles on each of these in the near future. For now I list them here:
Myth 1: Probabilistic methods need large amounts of data. False: most data exists in every ERP system and can be supplemented in similar fashion to its deterministic counterparts (such as promotional data). It can include much more data if desired and available to further isolate signal from noise, but that is optional.
Myth 2: Probabilistic methods need huge amounts of computing power. Only true if using the brute force approach of simulation for large data sets. False for closed form methods, which uses no more than deterministic equivalents, and often less.
Myth 3: Probabilistic plans and forecasts are difficult to interpret and use. False, they tend to provide richer information, allowing better informed business decisions. Where deterministic plans provide exact average quantities with an understood but unquantified uncertainty, probabilistic methods present the uncertainty accurately. Discussions change from politics to ones where the balance between cost and risk is decided.
Myth 4: Probabilistic plans and forecasts cannot be adjusted by humans. False. In fact, adjustments can be made exactly as desired, but the uncertainty skews when historical adjustments have been biased. This allows perfect alignment to biased sales forecasts or budgets without exploding supply chain costs to meet those.
Myth 5: Artificial Intelligence (AI) and Machine Learning (ML) are probabilistic. Mostly false. There are some AI methods that could be considered probabilistic, although most of those naively assume a normal distribution applies. The vast majority are purely deterministic. That said, AI/ML can be used to complement probabilistic methods where those are weak, for example when there is no or little historical data.
Conclusion
Probabilistic methods are the future. They are the correct foundational building block for domains that contain uncertainty. This includes all types of forecasting and all types of planning processes. The traditional deterministic methods assume incorrectly that uncertain values can be safely approximated by some average single number. Forecasts that are always wrong, plans that are infeasible by the time they are published because things changed, and perpetual expediting and fire-fighting are the direct consequences of this one assumption. These methods are fundamentally flawed and cannot be salvaged. They are precise, when accuracy is what is needed.
The fundamentally correct way, probabilistic methods, however are difficult to develop. It will require much greater sophistication from software and software developers in order to make their solution much less complex than traditional systems for the planners and forecasters.
It will also require some epiphanies from all involved. Not least that accuracy and precision have been bastardized in the forecasting domain, and need to be reinvented to match all other domains. But no less that all deterministic metrics are inadequate to the needs because they fail to capture this distinction cleanly. Many still have value in the probabilistic worldview, but not how they are used today. More on that in future articles.


